|

|
DataShare Metro Richmond
Bridging the Gap ... Data Serving Us All
|
|
|
|
|
|
|
| |
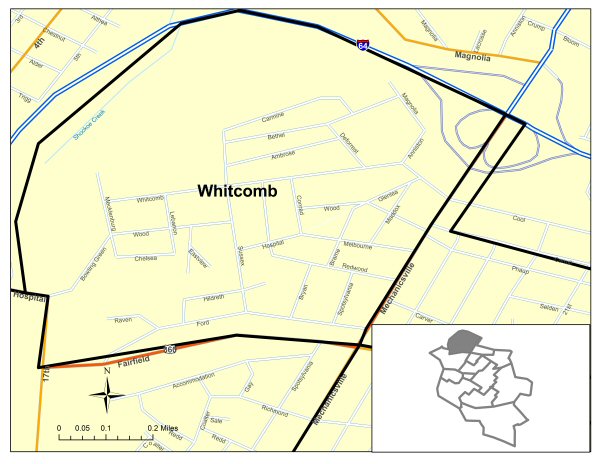
Housing Data for Whitcomb
 Please note: Large Map images are approximately 800 Kb - 1 Mb in size. Please note: Large Map images are approximately 800 Kb - 1 Mb in size.
| |
| Total Housing Units |
921 |
92,282 |
2,904,192 |
| Built in 1990s to March 2000 |
1.63% |
3.47% |
19.96% |
| Built in 1980s |
3.69% |
7.34% |
19.63% |
| Built in 1970s |
20.20% |
14.25% |
19.63% |
| Built in 1960s |
25.62% |
15.78% |
13.93% |
| Built in 1950s |
23.02% |
17.77% |
11.24% |
| Built in 1940s and earlier |
25.84% |
41.39% |
15.61% |
| Median year structure built |
* |
1955 |
1975 |
| |
| Total Housing Units |
921 |
92,282 |
2,904,192 |
| Single-Family |
51.14% |
57.11% |
71.97% |
| Multifamily |
48.21% |
42.14% |
21.54% |
| Other |
0.65% |
0.75% |
6.50% |
| |
| Total Occupied Units |
847 |
84,549 |
2,699,173 |
| Average household size |
* |
2 |
3 |
| Overcrowded units |
16.29% |
3.72% |
3.20% |
| Median number of rooms |
* |
5.1 |
6 |
| |
| Median gross rent |
* |
$540 |
$650 |
| Median home value |
* |
$87,300 |
$125,400 |
| Owner Occupied Housing Units |
261 |
39,010 |
1,837,958 |
| Owners paying over 35% of household income for selected housing costs |
16.48% |
17.92% |
11.59% |
| Renter Occupied Housing Units |
586 |
45,539 |
861,215 |
| Renters paying over 35% of household income for selected housing costs |
23.04% |
33.35% |
25.76% |
| |
| Total Occupied Housing Units |
847 |
84,549 |
2,699,173 |
| Owner-occupied |
30.81% |
46.14% |
68.09% |
| Renter-occupied |
69.19% |
53.86% |
31.91% |
| |
| Total |
921 |
92,282 |
2,904,192 |
| Occupied |
91.97% |
91.62% |
92.94% |
| Vacant |
8.03% |
8.38% |
7.06% |
|
|
|
© 2010 DataShare Metro Richmond Hosted by Virginia Commonwealth University
|