|

|
DataShare Metro Richmond
Bridging the Gap ... Data Serving Us All
|
|
|
|
|
|
|
| |
Employment Data for Manchester
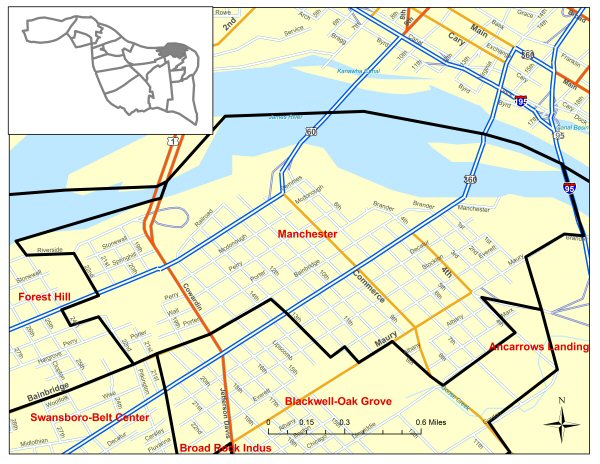 Please note: Large Map images are approximately 800 Kb - 1 Mb in size. Please note: Large Map images are approximately 800 Kb - 1 Mb in size.
| |
Work Location |
|
|
|
| Total workers 16 years old and over |
6,992 |
88,924 |
3,481,820 |
| Total workers 16 years and over who did not work at home |
97.67% |
97.73% |
96.84% |
| Worked at home |
2.33% |
2.27% |
3.16% |
Mode |
|
|
|
| Total workers 16 years old and over |
6,992 |
88,924 |
3,481,820 |
| Car, truck, or van (alone or carpooled) |
94.67% |
83.11% |
89.81% |
| Public transportation |
1.02% |
8.27% |
3.57% |
| Bicycle |
0.21% |
1.09% |
0.23% |
| Walked |
1.09% |
4.43% |
2.31% |
| Other |
0.61% |
0.71% |
0.83% |
| Worked at home |
2.33% |
2.27% |
3.16% |
Travel Time |
|
|
|
| Total workers 16 years and over who did not work at home |
6,829 |
86,901 |
3,371,753 |
| Less than 15 minutes |
22.49% |
28.67% |
24.60% |
| 15-29 minutes |
46.95% |
47.63% |
37.40% |
| 30-59 minutes |
25.19% |
18.86% |
29.64% |
| One hour or more |
5.37% |
4.85% |
8.36% |
| |
| Total Population 16 years and over |
10,405 |
158,612 |
5,529,980 |
| In labor force |
71.02% |
62.42% |
66.81% |
| Not in labor force |
28.98% |
37.58% |
33.19% |
| Total Civilian in Labor Force |
7,365 |
98,688 |
3,563,772 |
| Employed |
96.55% |
91.95% |
95.76% |
| Unemployed |
3.45% |
8.05% |
4.24% |
| Total Unemployed |
3,269 |
67,546 |
1,986,442 |
| Male |
26.46% |
26.92% |
3.78% |
| Female |
44.85% |
43.86% |
3.82% |
|
|
|
© 2010 DataShare Metro Richmond Hosted by Virginia Commonwealth University
|